GANTT Chart
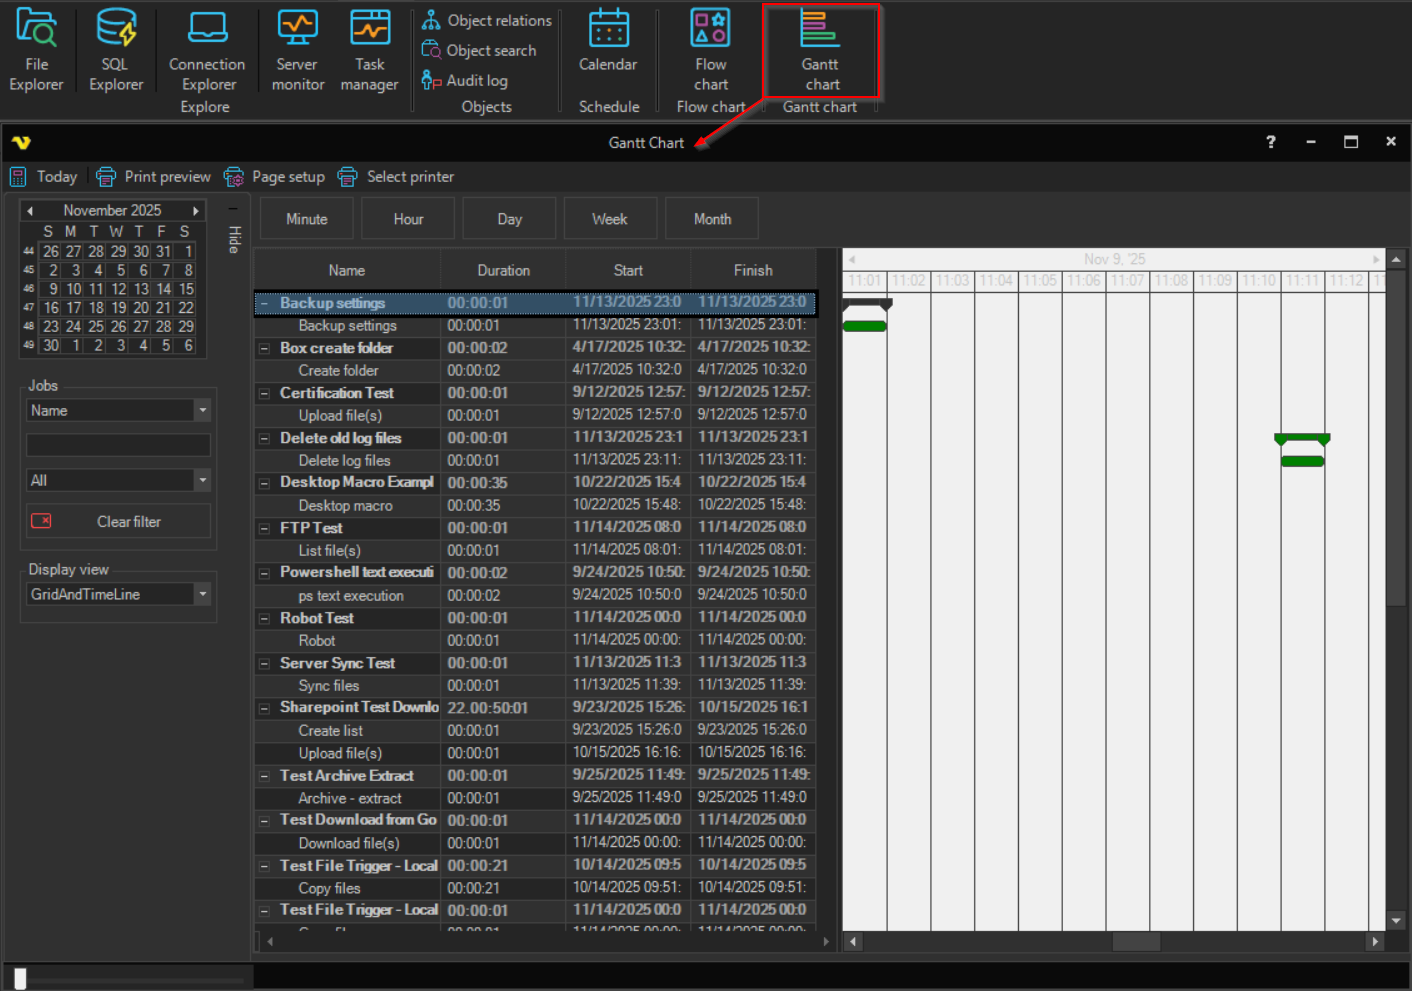
The GANTT chart lets you view a timeline view of current Jobs. When they will execute and how long time (based on previous execution).
Time scale
You can change the timeline scale using the Minute, Hour, Day, Week and Month options. The Today button returns the view to the current date. A zoom slider in the status bar adjusts the width of the timeline.
View
The toolbar provides Day, Week and Month views, as well as Show Time exceptions and Use Time exceptions options.
Display view
The Display view option lets you choose whether to show both the grid and the timeline, the grid only or the timeline only.
Filter
It is possible to filter the GANTT grid on certain criterias like Job name, group name etc. Select the column to filter on and enter the value. The Clear filter button resets the filter.
Grid
The grid lists the Jobs together with their start and end date/time and duration. The timeline bars are colored according to status.
The Print preview, Page setup and Select printer options let you print the GANTT chart.