Health - Server Health
In the main menu Server > Health > Server health dialog, a diagram of the last changes in the Server health level is displayed, as well as the conditions of the current health level and a list of previous levels from the event log.
Health > [current Server health level]
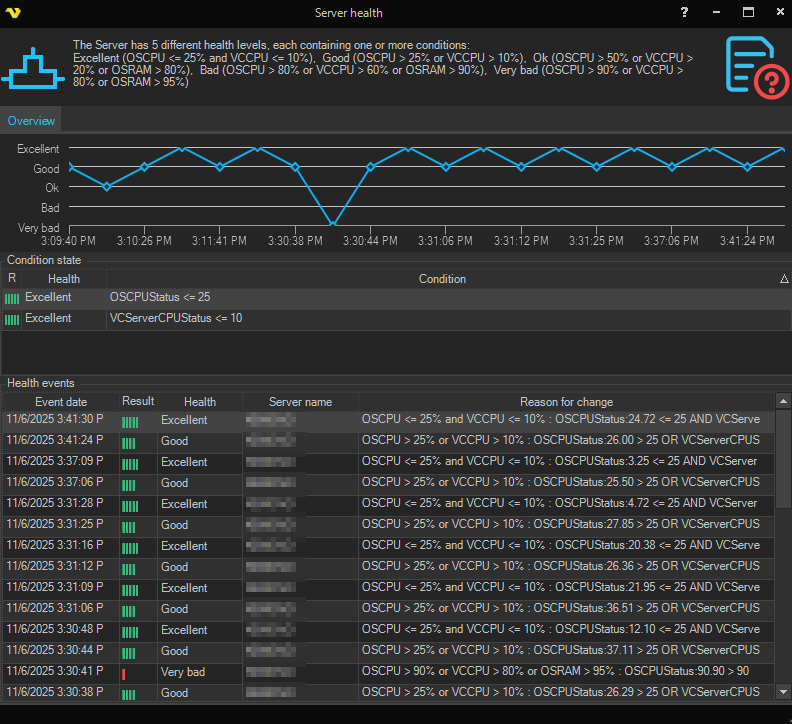
The Overview tab contains:
- A diagram of the recent changes in the Server health level.
- A Condition state section listing the conditions of the current health level.
- A Health events section listing the previous health level changes, with the columns Event date, Result, Health, Server name and Reason for change.
A Settings tab is also available (when the Server health settings feature is licensed) where each health level and its conditions are shown and can be edited. The Reset to default button restores the default conditions.
Server health levels*
*default health settings for version 10.0.2
Abbreviations:
- OSCPU - Total CPU consumption (%)
- VCCPU - CPU consumption by VisualCron Server (%)
- OSRAM - System memory in use (%)
| Level | Name | Conditions |
|---|---|---|
| Excellent | OSCPU <= 25% and VCCPU <= 10% | |
| Good | OSCPU > 25% or VCCPU > 10% | |
| OK | OSCPU > 50% or VCCPU > 20% or OSRAM > 80% | |
| Bad | OSCPU > 80% or VCCPU > 60% or OSRAM > 90% | |
| Very Bad | OSCPU > 90% or VCCPU > 80% or OSRAM > 95% |