Job - Result
The Job result window is similar to Task output and result window but collects statistics and results for the whole Job.
Accessing Job Result
You can access the Job result window the following ways;
- double click on the result (success/failure) icon in the Job row
- double click on the result (success/failure) text in the Job row
- right click on the Job->Result->Job result
Execution
Date of execution
In the date picker you select which day you would like to view result from. The amount of data stored is determined by the database log settings in server settings. In the date picker you can see available dates where you have at least one execution. Whenever you select a date the available times the Task has been executed is listed in the Time selection box under.
Execution time
This is based on the Date of execution selection. In front of the time you see the result of the Task - if it was a success or failure.
Time of execution
This is the total time the Job ran.
Success/Failure button
Clicking this button show charts and statistics related to execution result.It is possible to control the range of executions. Success is marked in green and Failure in red. It is possible to zoom in and out in chart holding CTRL+Scroll wheel.
Job results
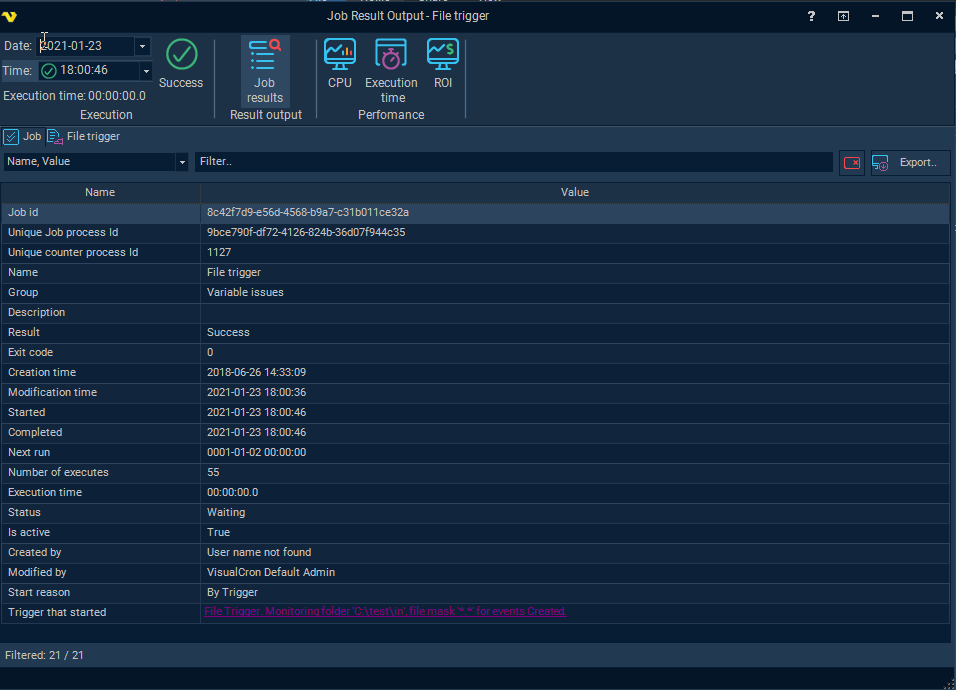
Job results panel has at least one tab, "Job". This tab contains general information when, how and who started the Job among other things.
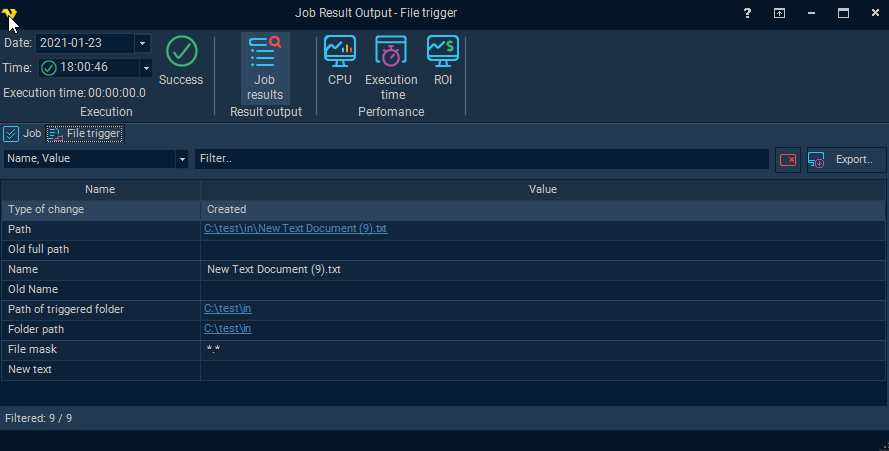
Depending on how it was started it might contain a Trigger tab. This will contain specific information about the Trigger, and what caused it to Trigger, at the moment of execution. Above you can see the File Trigger results tab. In that tab you can see, for example, which exact file caused the Trigger to trigger and in which folder it was created it. The information available depends on the Trigger type.
By right clicking on any row in Job results you can copy the underlying Variable which might be interesting if you want to use it in a Notification or similar.
Performance->CPU
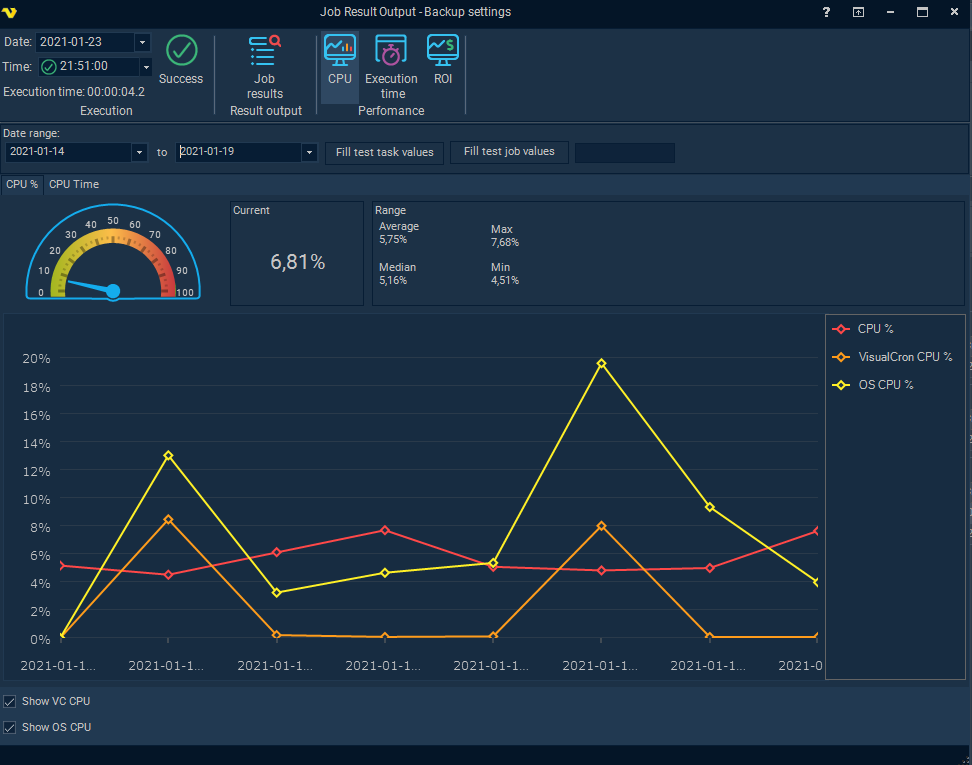
The CPU chart displays the CPU usage for each execution. These are approximate values VisualCron calculate and log during execution to see the cost of the CPU usage during different operations. The information can be used to schedule Jobs and Tasks during different hours - to spread the CPU load.
There are two main views:
- CPU % - this is a % being used during the execution time period
- CPU Time - this is the cost value for the CPU during the execution time period
The CPU % view shows the following:
- CPU % - the overall CPU % used by the Job during the execution time period
- VisualCron CPU - how much CPU % the VisualCron Server consumed during that time, so general usage can be compared. Enable it with the Show VC CPU checkbox.
- OS CPU - how much CPU % the operating system was using at that moment. Enable it with the Show OS CPU checkbox.
The CPU Time view is separated into the following categories:
- Job thread - how much CPU time is consumed by the Job thread itself
- Tasks - how much CPU time is consumed by the Job's Tasks
- Notifications - how much CPU time is consumed by Notifications
- Triggers - how much CPU time is consumed by Triggers
There is a chart showing the latest value which is based on the selection Date + Time in the top left window. The data range defines the period being used for the line chart and the range values - this is controlled by the date range controls. It is possible to zoom with the mouse wheel and mark certain areas.
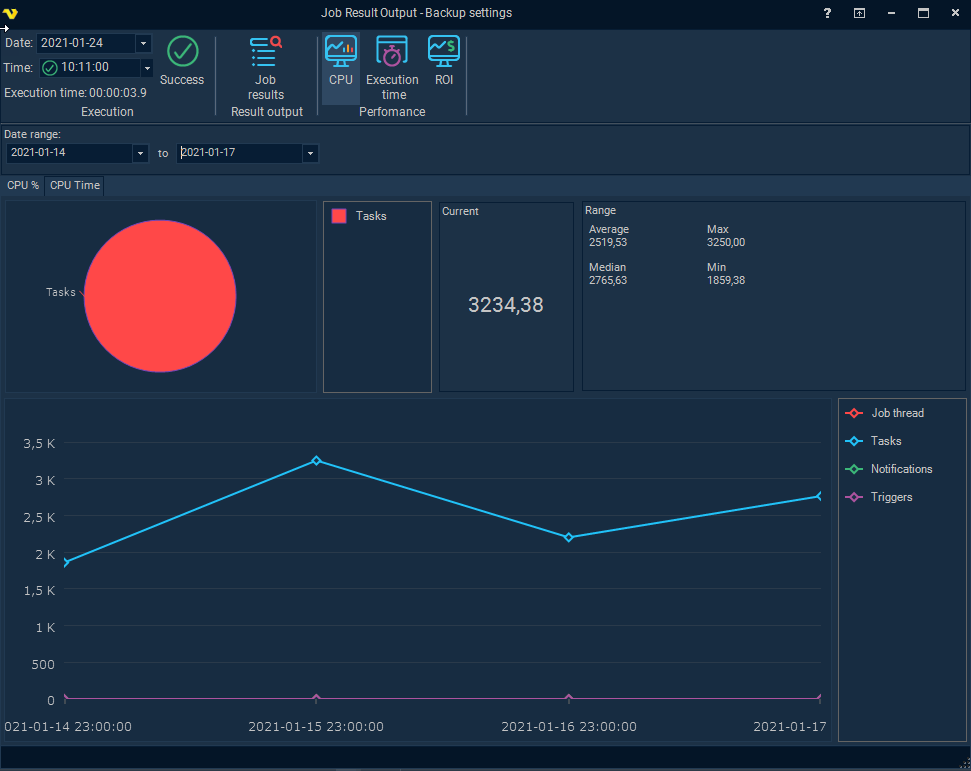
In the Job result->Performance CPU->CPU time you can see how much the CPU spent on Job, Task, Trigger and Notification. In general the footprint is low in VisualCron and you would see most work in the Task.
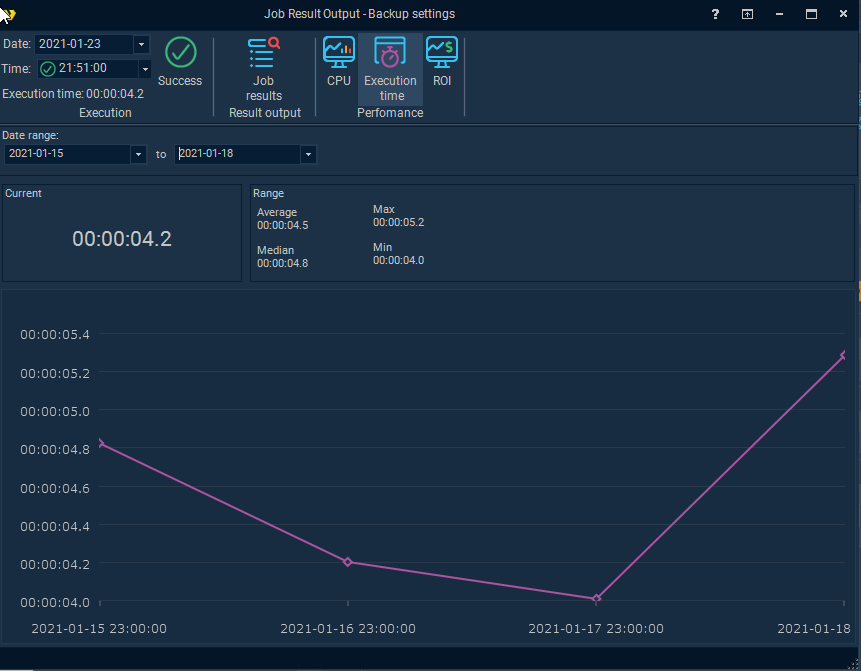
Performance->Execution time
The Execution time is how long it takes for a Job to complete. This is affected by the CPU load and the amount of data being processed and the delay in any external service. The charts help VisualCron users to get an overview, over time, how long time it takes for a specific operation.
The date range controls the line chart and range values. The current value is controlled by the selected Date + Time in the top left window.
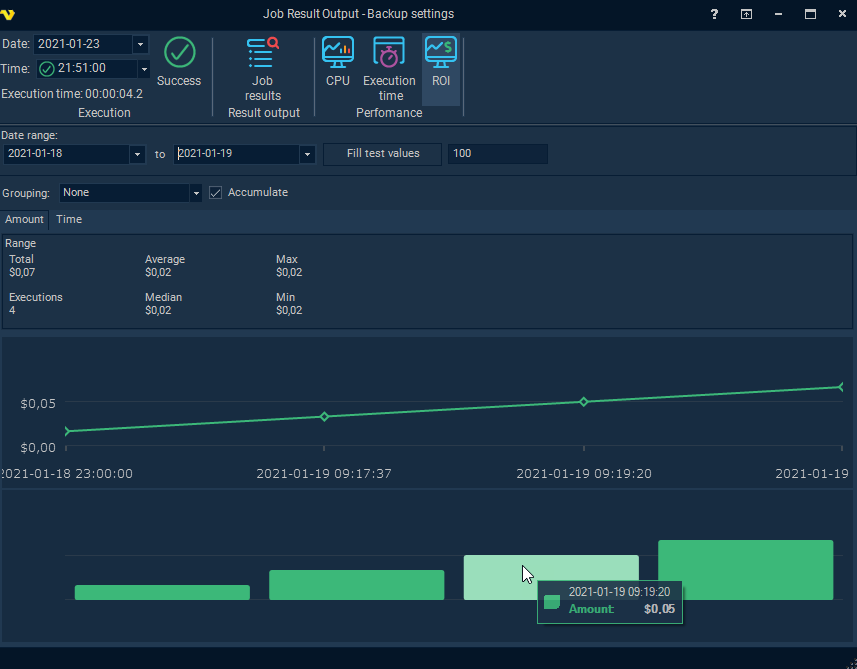
Performance->ROI
The stats in the ROI tab shows how much each execution of a Job, during a period, saved the company.